Your business made ₹10 lakh in sales this month.
Sounds great.
But how much of that ₹10 lakh did you actually keep?
After paying suppliers, salaries, rent, electricity, transportation, marketing, and other operating expenses, the number left behind may look very different.
This is where many small business owners confuse revenue with profitability.
A growing sales figure is encouraging, but it doesn't necessarily mean the business is becoming more profitable.
A profit and loss dashboard for small business helps owners move beyond the headline sales number and understand what's actually happening to their money.
Revenue Is Not Profit
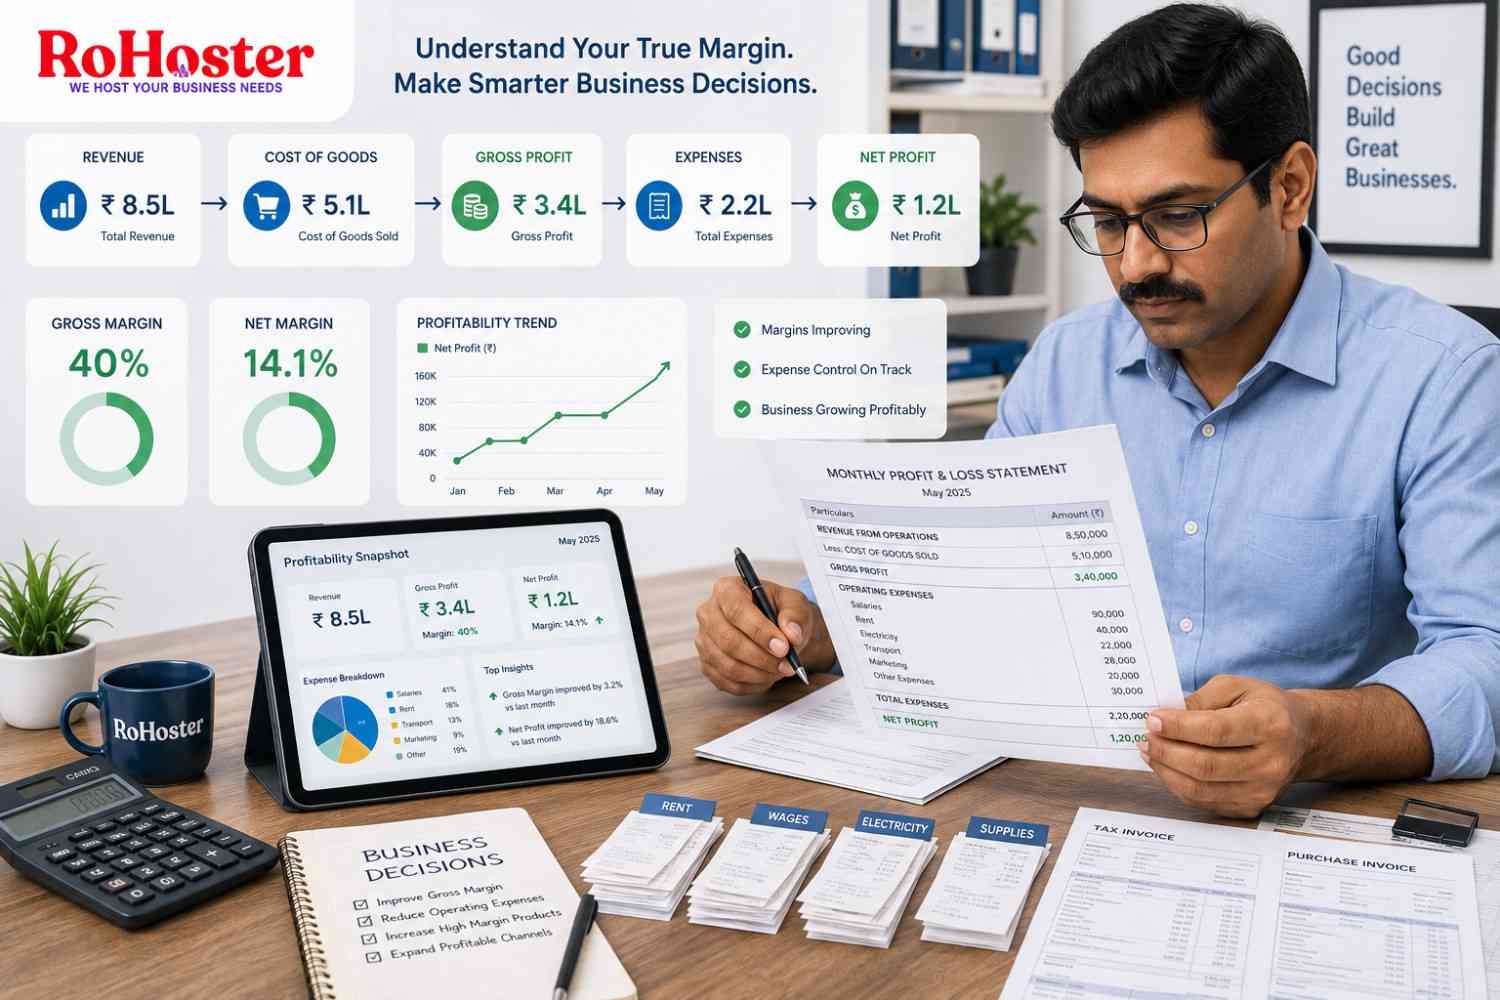
Suppose your business generates ₹8,50,000 in monthly revenue.
Your products cost ₹5,10,000 to purchase or manufacture.
That leaves:
Revenue: ₹8,50,000
Cost of Goods Sold: ₹5,10,000
Gross Profit: ₹3,40,000
But you're not done yet.
You still have expenses such as:
- Rent
- Salaries
- Electricity
- Transportation
- Marketing
- Software
- Repairs
- Administrative expenses
If those expenses total ₹2,20,000, your final profit is:
Net Profit: ₹1,20,000
Suddenly, ₹8.5 lakh in sales becomes ₹1.2 lakh in actual profit.
That's the number business owners need to understand.
What Is Gross Profit Margin?
Gross margin shows how much money remains after accounting for the direct cost of the products or services you sell.
Using the previous example:
Revenue = ₹8,50,000
Gross Profit = ₹3,40,000
Your gross margin is:
₹3,40,000 ÷ ₹8,50,000 × 100 = 40%
That means the business retains 40% of its revenue before operating expenses are considered.
Gross margin helps answer an important question:
Are the products or services themselves profitable enough?
If gross margin keeps falling, businesses may need to investigate pricing, supplier costs, discounts, or product mix.
What Is Net Profit Margin?
Net margin goes one step further.
It considers operating expenses as well.
If your net profit is ₹1,20,000 on ₹8,50,000 in revenue:
Net Margin = 14.1%
This gives a much clearer picture of the overall profitability of the business.
A company can have a healthy gross margin but a weak net margin if operating expenses are too high.
That's why owners need visibility into both.
Why Monthly Spreadsheets Aren't Enough
Many businesses calculate profitability only at the end of the month.
Until then, owners mostly watch sales.
The problem is that expenses continue accumulating throughout the month.
If sales increase by 15% but operating expenses increase by 30%, profitability could actually decline.
A live P&L dashboard updates the picture as new sales and expenses are recorded.
Instead of discovering the problem weeks later, owners can see profitability trends much earlier.
Every Expense Should Update Your Profit Picture
Imagine your current estimated monthly profit is ₹2,40,000.
Then the business records:
₹35,000 in advertising.
₹20,000 in equipment repairs.
₹15,000 in additional transportation expenses.
Your profitability has changed.
A connected business management software can reflect these expense entries in business reports rather than forcing owners to manually rebuild their calculations every time something changes.
This creates a much more realistic picture of business performance.
Track Expenses by Category
Knowing that expenses are rising isn't enough.
You need to know which expenses are rising.
Expenses can be categorized into areas such as:
- Salaries
- Rent
- Utilities
- Transportation
- Marketing
- Repairs
- Supplies
- Administrative costs
Once expenses are categorized, owners can identify exactly where profitability is being affected.
For example, revenue may be stable while transportation costs increase month after month.
Without categorized expenses, that trend can remain hidden.
Our article Track Daily Sales, Cash-in-Hand, and Business Expenses Without the Hassle explains how recording and categorizing expenses consistently creates better visibility into everyday business finances.
Understand Which Products Actually Make Money
Your highest-selling product isn't necessarily your most profitable one.
Consider two products:
Product A
Selling Price: ₹1,000
Cost: ₹850
Gross Profit: ₹150
Product B
Selling Price: ₹700
Cost: ₹400
Gross Profit: ₹300
Product A generates more revenue per sale.
Product B generates twice the gross profit.
This is why profitability analysis should go beyond total sales.
When product and sales information is organized properly, owners can make better decisions about pricing, purchasing, promotions, and inventory.
Discounts Can Quietly Destroy Margin
Discounts often increase sales—but they can also reduce profitability faster than expected.
Suppose a product sells for ₹1,000 and costs ₹700.
Your gross profit is ₹300.
Now offer a 20% discount.
The selling price becomes ₹800.
Your gross profit falls to ₹100.
Revenue decreased by 20%, but your gross profit decreased by more than 66%.
A good profit margin tracking system helps owners understand the financial impact of discounts rather than judging promotions purely by sales volume.
Connect Inventory With Profitability
Inventory also has a direct impact on business performance.
Money invested in products that don't sell remains locked in stock.
That capital cannot be used for marketing, expansion, hiring, or purchasing better-performing products.
This is especially important for businesses carrying large inventories.
Our article 5 Proven Strategies to Reduce Dead Stock and Free Up Business Cash Flow explains how identifying slow-moving stock can improve both inventory efficiency and working capital.
Don't Confuse Profit With Cash-in-Hand
A profitable business can still experience cash-flow problems.
Suppose you make a ₹1 lakh sale on customer credit.
Your revenue increases.
But you haven't received the ₹1 lakh yet.
Meanwhile, salaries, rent, and supplier payments still need to be paid.
That's why businesses should monitor profitability and cash flow separately.
If customer credit forms a significant part of your operations, Moving Beyond the Red Khata: Digitizing Customer Udhaar and Credit Limits explains how better receivable tracking can improve visibility over money that is still outstanding.
Compare Performance Over Time
A single profit number tells you what happened.
A trend tells you where the business is going.
Owners should compare:
This Month vs. Last Month
This Quarter vs. Previous Quarter
Current Margin vs. Previous Margin
This can reveal whether the business is becoming more efficient as it grows.
For example:
Revenue ↑ 18%
Expenses ↑ 9%
Net Profit ↑ 31%
That's very different from:
Revenue ↑ 18%
Expenses ↑ 35%
Net Profit ↓ 8%
Sales increased in both cases.
But only one represents healthier growth.
Use P&L Data Before Making Big Decisions
Should you hire another employee?
Open another outlet?
Increase advertising?
Negotiate with suppliers?
Raise prices?
Introduce discounts?
These decisions shouldn't be based purely on how busy the business feels.
A clear profit and loss dashboard provides financial context.
If margins are strong and improving, expansion may be easier to support.
If expenses are growing faster than revenue, cost control may need attention first.
Better visibility leads to better decisions.
Set Margin Targets
Instead of only tracking sales targets, businesses can also establish profitability targets.
For example:
Revenue Target: ₹10 lakh
Gross Margin Target: 42%
Net Margin Target: 15%
Now the goal isn't simply to sell more.
The goal is to grow profitably.
This encourages teams to think about pricing, costs, discounts, and operating efficiency alongside revenue.
Why Growing SMEs Need Better Financial Visibility
When a business is small, the owner may understand most financial activity personally.
As the company grows, that becomes harder.
More employees create more expenses.
More customers create more transactions.
More products create more inventory decisions.
More locations create more operational complexity.
This is where centralized software for small business becomes valuable.
Instead of relying on disconnected spreadsheets and reports, owners can build a clearer picture using information generated through everyday operations.
How RoHoster Can Help
RoHoster helps businesses bring operational information into a more centralized cloud-based environment.
By keeping important business records organized, owners can build better visibility into sales, expenses, inventory, customers, and overall business activity.
Depending on the implemented features and configuration, RoHoster can support areas such as:
- Sales records
- Expense information
- Billing
- Inventory
- Customer management
- Business reports
- Cloud-based access
The objective isn't simply to show more numbers.
It's to make those numbers easier to understand and use when making business decisions.
Conclusion
Revenue tells you how much your business sells.
Margin tells you how well your business actually performs.
Understanding gross profit, operating expenses, net profit, and cash flow gives business owners a far more accurate view of financial health than sales alone.
With a profit and loss dashboard for small business, owners can monitor these numbers more consistently and identify problems before they become expensive.
Because the goal isn't simply to grow revenue.
The goal is to grow profitably.
Further Reading
Want more practical insights on profitability, cash flow, business operations, and financial management?
Read the latest business insights from LarchSoft on LinkedIn