A distributor can process hundreds of orders in a week and still struggle to answer three surprisingly important questions:
Which products are actually making us money?
Which customers are driving our sales?
Which sales representatives are performing best?
Knowing total weekly sales isn't enough.
A business could generate ₹20 lakh in revenue while margins decline, major customers reduce their orders, or one salesperson consistently misses targets.
That's why growing wholesalers and distributors need more than transaction records.
They need business reporting tools that turn everyday sales data into information they can actually use.
For most distributors, three reports deserve attention every single week.
Report #1: Product Profitability Report
The first report answers one fundamental question:
What are we actually making money on?
Many businesses naturally focus on their highest-selling products.
But the product generating the most revenue isn't necessarily the product generating the most profit.
Consider two products.
Product A
Weekly Sales: ₹4,00,000
Product Cost: ₹3,60,000
Gross Profit: ₹40,000
Product B
Weekly Sales: ₹2,50,000
Product Cost: ₹1,75,000
Gross Profit: ₹75,000
Product A generates significantly more revenue.
But Product B contributes almost twice as much gross profit.
Without a product profitability report, management may continue prioritizing Product A simply because its sales number looks impressive.
What Should a Product Report Show?
A useful weekly product report should help distributors monitor:
- Units sold
- Sales revenue
- Purchase cost
- Gross profit
- Gross margin percentage
- Discounts given
- Returns
- Product movement
The objective is to understand both sales volume and profitability.
This can reveal products that generate high sales but weak margins, as well as products that deserve greater attention because they contribute disproportionately to profit.
Watch Margin Changes Every Week
Suppose one of your products normally delivers a 25% gross margin.
This week it drops to 18%.
Why?
Possible reasons include:
- Supplier costs increased
- Excessive discounts were offered
- Selling prices changed
- Transportation costs increased
- Product returns increased
If management only checks revenue, this problem can remain hidden.
Weekly margin analysis makes changes visible much earlier.
Identify Slow-Moving Products Too
A good product report shouldn't only highlight your winners.
It should also identify products that aren't moving.
Imagine ₹8 lakh of your working capital is sitting in products that have barely sold during the past 90 days.
That inventory may eventually require discounting or become obsolete.
Weekly reporting allows distributors to spot declining product movement earlier and adjust purchasing accordingly.
Report #2: Top Customer Sales Report
Your second critical weekly report should answer:
Who is buying from us?
Wholesale businesses often depend heavily on repeat buyers.
A distributor may have hundreds of customer accounts, but a relatively small group can contribute a significant portion of total revenue.
That's why understanding customer-level sales trends is essential.
Identify Your Top Customers
A customer sales report can rank buyers based on factors such as:
- Weekly sales
- Monthly sales
- Order frequency
- Average order value
- Total lifetime purchases
- Outstanding balance
- Last purchase date
Suppose your report shows:
Customer A: ₹3.8 lakh
Customer B: ₹2.7 lakh
Customer C: ₹2.1 lakh
These accounts deserve attention.
Not necessarily because they should receive discounts, but because their purchasing behaviour has a meaningful impact on the business.
Look Beyond the Top-Customer Ranking
Simply knowing who your biggest customer is isn't enough.
You also need to understand how their behaviour is changing.
Suppose a customer normally purchases ₹4 lakh every week.
This week, they purchased ₹2.5 lakh.
Next week, ₹1.8 lakh.
The customer may still appear among your top buyers.
But the trend is clearly moving in the wrong direction.
Weekly reporting helps management identify this change before the customer disappears entirely.
Identify Customers Who Are Growing
The opposite pattern is equally valuable.
A retailer who previously ordered ₹50,000 per month may now be purchasing ₹1.5 lakh.
That customer could represent an opportunity for:
- Higher credit limits
- Larger order quantities
- Priority service
- Product recommendations
- Better account management
Customer reporting helps sales teams identify opportunities based on actual purchasing behaviour rather than assumptions.
Watch Customer Concentration
There's another important question every distributor should ask:
How dependent are we on our biggest customers?
Suppose your top five customers generate 65% of total revenue.
Losing even one major account could significantly affect your business.
A weekly customer report helps management monitor this concentration and work toward building a more diversified customer base.
Use Purchase History to Improve Repeat Sales
Customer data isn't only useful for wholesalers.
The same principle applies across businesses: previous purchasing behaviour can help predict future opportunities.
Our article How Local Retailers Can Use Customer Purchase History to Drive Repeat Sales explains how organized purchase history can support more relevant offers and stronger customer relationships.
For distributors, similar information can help account managers understand when customers normally reorder and which products they purchase most frequently.
Report #3: Sales Representative Performance Report
Your products are performing well.
Your customers are buying.
But now there's another question:
How effectively is your sales team converting opportunities into revenue and collections?
A distributor with multiple sales representatives needs visibility into individual performance.
Without reporting, managers may judge performance based on activity rather than results.
What Should You Measure?
A weekly sales representative performance report can track metrics such as:
- Sales target
- Sales achieved
- Number of orders
- New customers added
- Existing customer sales
- Average order value
- Outstanding collections
- Payment collections
- Returns or cancellations
This creates a more balanced view of performance.
Don't Measure Salespeople Only by Revenue
Imagine two sales representatives.
Salesperson A
Sales: ₹8 lakh
Collections: ₹4.5 lakh
Salesperson B
Sales: ₹6.5 lakh
Collections: ₹6 lakh
Who performed better?
If the company only measures sales, the answer appears to be Salesperson A.
But if cash collection is important, the picture becomes more complicated.
This is why sales performance should consider both revenue generation and payment collection.
Compare Performance Against Targets
Raw sales figures mean little without context.
If one salesperson generates ₹7 lakh in sales against a ₹5 lakh target, they have achieved:
140% of Target
Another salesperson generating ₹8 lakh against a ₹12 lakh target has achieved:
67% of Target
The second salesperson generated more revenue but performed further below expectations.
Targets make reports more meaningful.
Find Coaching Opportunities
Sales reports shouldn't exist purely to rank employees.
They can also help managers understand where employees need support.
For example, one representative may generate many new leads but struggle to convert them.
Another may retain customers well but generate few new accounts.
A third may achieve strong sales but struggle with collections.
These patterns allow managers to provide more specific coaching.
When customer enquiries and opportunities need better organization, structured lead management can help teams monitor prospects and follow-ups more consistently.
Put the Three Reports Together
Each report tells part of the story.
The real value appears when management reviews them together.
Suppose your weekly reports show:
Product Report: Product X has the highest margin.
Customer Report: Customer A frequently purchases Product X.
Sales Team Report: Salesperson Rahul manages Customer A.
Now management has useful context.
Perhaps Rahul's sales strategy for Product X can be replicated across other accounts.
Or perhaps similar customers can be targeted with the same product.
This is how reporting moves from describing the business to improving the business.
Create a Weekly Management Routine
Reports are only useful when someone reviews them.
A distributor can establish a simple weekly business review.
Every Monday morning, management reviews:
1. Product Performance
What's selling?
What's profitable?
What's slowing down?
2. Customer Performance
Who bought the most?
Who's buying more?
Who's buying less?
3. Sales Team Performance
Who's achieving targets?
Who's collecting payments?
Where are opportunities being missed?
This doesn't need to become a three-hour meeting.
The goal is to identify the handful of numbers that actually require action.
Don't Forget Cash Collections
High sales are encouraging.
But wholesale businesses often sell on credit.
That means a salesperson can generate impressive sales while customer payments remain outstanding.
Weekly reports should therefore include receivables and collections.
A ₹10 lakh sale doesn't help today's liquidity if payment isn't expected for another 60 days.
Our article Why Cash Flow Crises Kill Profitable SMEs (And How Software Prevents It) explains why growing businesses need to track the timing of cash inflows alongside profitability.
Automate Report Generation
The biggest problem with business reports is often the time required to prepare them.
Employees export spreadsheets.
Someone combines the files.
Another employee calculates margins.
Sales numbers are updated manually.
By the time management receives the report, the information may already be outdated.
Modern business management software can reduce this repetitive work by generating reports from information already recorded during everyday operations.
Instead of spending hours creating reports, teams can spend that time understanding them.
Turn Reports Into Alerts
Not every metric requires a manager to constantly watch a screen.
Businesses can define conditions that require attention.
For example:
Gross Margin < 15% → Review Product
Customer Sales ↓ 30% → Account Manager Alert
Sales Target < 70% → Manager Review
Outstanding Collection > 45 Days → Follow-Up
This transforms reporting from passive information into actionable management.
Keep Reporting Simple
More data doesn't automatically mean better decisions.
A distributor could track hundreds of metrics.
Most won't matter every week.
The best business reporting tools for distributors make important information easy to identify rather than overwhelming users with charts.
A weekly report should help management answer:
What changed?
Why did it change?
Does it require action?
That's far more useful than having dozens of dashboards nobody reviews.
How RoHoster Can Help
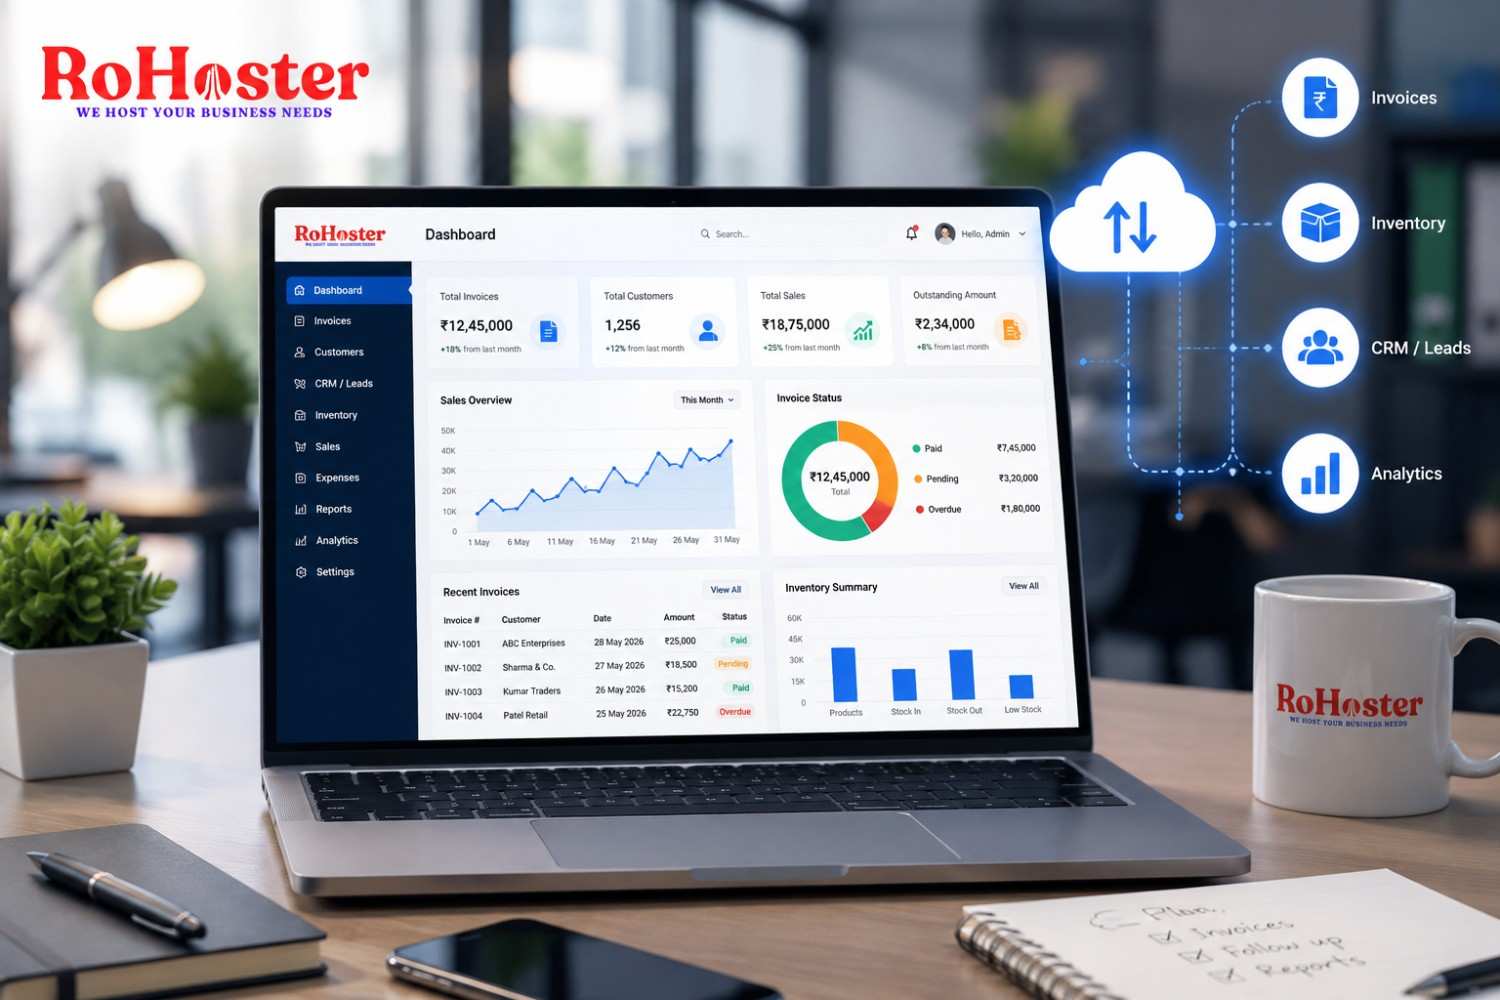
RoHoster helps businesses organize operational information in a centralized cloud environment.
For distributors and stockists, bringing sales, customers, inventory, billing, and business records together can make reporting more useful.
Depending on the available features and business configuration, RoHoster can support areas such as:
- Sales reporting
- Customer records
- Product information
- Inventory
- Billing
- Lead management
- Expense information
- Business reports
- Cloud-based access
When everyday business information is structured, owners don't have to rely entirely on assumptions to understand performance.
They can use actual business data.
Conclusion
You don't need hundreds of reports to understand your distribution business.
Start with three.
Which products are generating the best margins?
Which customers are driving—or reducing—their purchases?
Which sales representatives are delivering the strongest results?
Reviewing these three reports every week can reveal problems and opportunities that total sales figures simply can't show.
Because good reporting isn't about collecting more numbers.
It's about finding the few numbers that help you make a better decision.
Further Reading
Want more practical insights on business reporting, sales management, automation, and distribution operations?
Read the latest business insights from LarchSoft on LinkedIn